 Photo by Firmbee.com on Unsplash  As I was scrolling through Facebook I had the surreal experience of seeing a tweet of mine being shared. I am still getting used to the idea that my comments are able to provoke discussion about how we can provide our children with a great education. The tweet focused on how our school’s data is indicating that our reading intervention program is effective. One response that I glimpsed challenged me to share how we are using data to come to this conclusion. This is an important question given that education seems to be a world where everything is claiming to be ‘evidence-based’. I will start with NAPLAN, the national assessment program for grades 3, 5, 7 and 9. After a hiatus in 2020, it returned in 2021. Our students in grade 3 & 5 participated and I was eager to see the results. I see NAPLAN as a snapshot that allows schools to keep the finger on the pulse of how we are tracking. It certainly has limits (the turnaround time of three months before getting results has been one). A smaller school like mine also acknowledges that the results can be cohort driven. Why was I keen for results? Well, the Grade 3 cohort were all students of mine when they were in Grade 1. I taught half of them again when they were in Grade 2, while the other half were being taught by a Graduate Teacher whom I was mentoring. A common misconception is that NAPLAN is a reflection on the Grade 3 & 5 teachers. The reality is that NAPLAN is much more an assessment of the learning in the years prior. Therefore the results of our Grade 3 students were going to be a pretty clear measure of the impact of my teaching. One way to view students’ results is through the band they are in. At Grade 3 there are 6 bands. If a student is in the bottom band then they are below the national minimum standard. If a student is in the second band then they are at the national minimum standard. Students in the middle 2 and top 2 bands are above the national minimum standard. 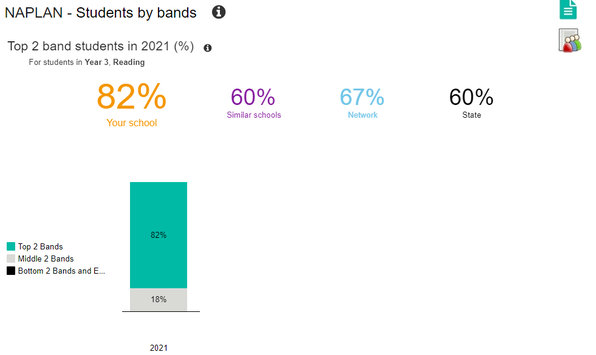 In 2021, 100% of our Grade 3 students were above the national minimum standard for Reading. In 2021, 82% of our Grade 3 students achieved results in the top 2 bands for Reading. These results are worth celebrating! The joy of teaching is that there are always ways to improve. In 2021 we started using DIBELS 8th Edition to assess our students in reading. Prior to NAPLAN, DIBELS had identified the 18% who achieved results in the middle 2 bands as ‘at some risk’ in reading. Two of these students had not previously been picked up through our previous formal assessments. Our NAPLAN results validated that DIBELS was providing more accurate data. Not only was DIBELS providing more accurate data, it was meaningful. In the middle of last year I assessed my Foundation students. One area of initial concern was Letter Naming Fluency (LNF). LNF assesses how many letters students can name in one minute. The letters are jumbled up and are (seemingly) randomly capitals or lowercase. The criteria determined that if students name less than 31 letters in a minute then they are at risk (marked in red), if they name between 31 and 36 then they are at some risk (denoted in yellow), if they name more than 36 words per minute then they are at minimal risk (green and blue). In May, half of my students were at risk in the LNF! Only four were at minimal risk. This was somewhat alarming. I recognised that these results were due to my instruction. I had been emphasising the sound letters can represent over the name of the letters. This approach had been having a tremendous impact on students ability to read and can be seen by the vast number of students with negligible risk (denoted in blue) for identifying the Correct Letter Sounds in the Nonsense Word Fluency (NWF) assessment. However, clearly there was still a gap in my teaching that needed to be addressed. Over the next 4 weeks I introduced daily explicit instruction in the names of letters. This took a maximum of 5 minutes per day, and was often closer to 2 minutes. I retested students on LNF after 4 weeks and the results were staggering. Because students had a strong knowledge of each grapheme, they were quickly able to attach a name to each one. What made these results even more impressive is that over this 4 week period we lost a number of instructional days due to Covid-19 lockdowns, a public holiday, the school closed for storms and I was absent for a number of days. In total, the improvement is a result of just 10 brief lessons on the names of letters. I have also included our LNF results from the end of 2021 to demonstrate that this remarkable improvement was maintained. 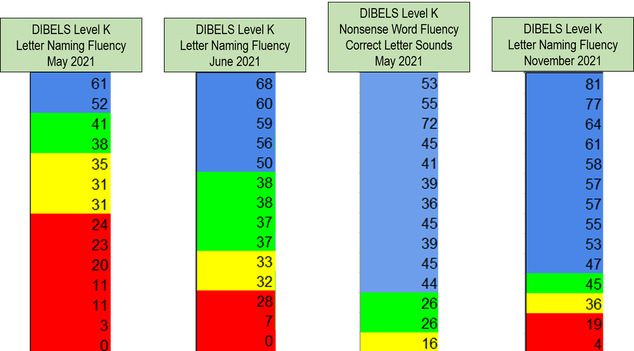 At the start of this year we assessed students using DIBELS. My tweet above was a reflection of our current Grade 2 students. A number of these students received intervention throughout 2021. You might be tempted to think that the nine students who received intervention were the bottom nine. You would be wrong. What is pleasing is that it is impossible to tell from this assessment who had intervention. This assessment helps signal to us the students who currently need intervention. Our intervention program is successful because we are able to bring our students who are at significant risk up to the level of their peers. This allows us to then provide intervention to other students who need additional support now. 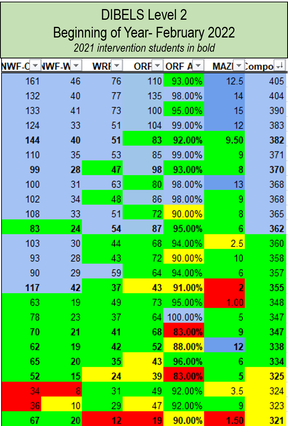 I am proud of my students and their learning. I am also proud of my colleagues’ efforts in teaching. Our data provides an important reflection of what is actually happening in our school. Our data is not perfect but we need to pause and appreciate the amazing teaching and learning that is occurring. As we celebrate we begin to roll up our sleeves and get to work on all the things that we still need to do. We may never arrive at perfect results, but we can still strive for excellence.
0 Comments
Leave a Reply. |
I'm JamesI am a father of two (8 & 5), married to a future Early Childhood Educator. Archives
September 2023
Categories |
 RSS Feed
